


Fundamental Analysis Software
Achieve this with TradeNeon
TradeNeon is a web-based fundamental analysis software that includes three tools: automatic analysis of the Commitment of Traders (CoT) report, identification of seasonal patterns, and tracking the development of the futures term structure. These are presented through 7 unique sentiment indicators covering 25 of the most crucial futures markets, all easily accessible on 1 distinctive dashboard. Find ideal trading opportunities to execute trades with confidence and high success rates! It has never been easier!
Dashboard
Fundamental Tools
Sentiment Indicators
Futures Markets
1 Dashboard
find trading opportunities at glance

The heart of TradeNeon. Here you’ll find the most important futures markets clearly arranged and listed in categories. The software automatically indicates whether a market is interesting on the short or long side based on certain fundamental factors. Those factors are based on our self-developed sentiment indicators. Clicking on any market takes you to its analysis board.
3 Tools
3 categories for your fundamental analysis
Tool1
Automatic CoT data analysis
The Commitment of Traders Report, published by the American state authority CFTC, has formed the basis for the fundamental analysis of professional traders for many years. It provides information about the positioning of large trading institutions. The report includes both commercial traders who are directly involved in the production or further processing of the respective commodity. However, it also shows us the positions of large speculators who want to participate in long-term trend movements. TradeNeon shows you at a glance what the insiders are doing!

Tool 2
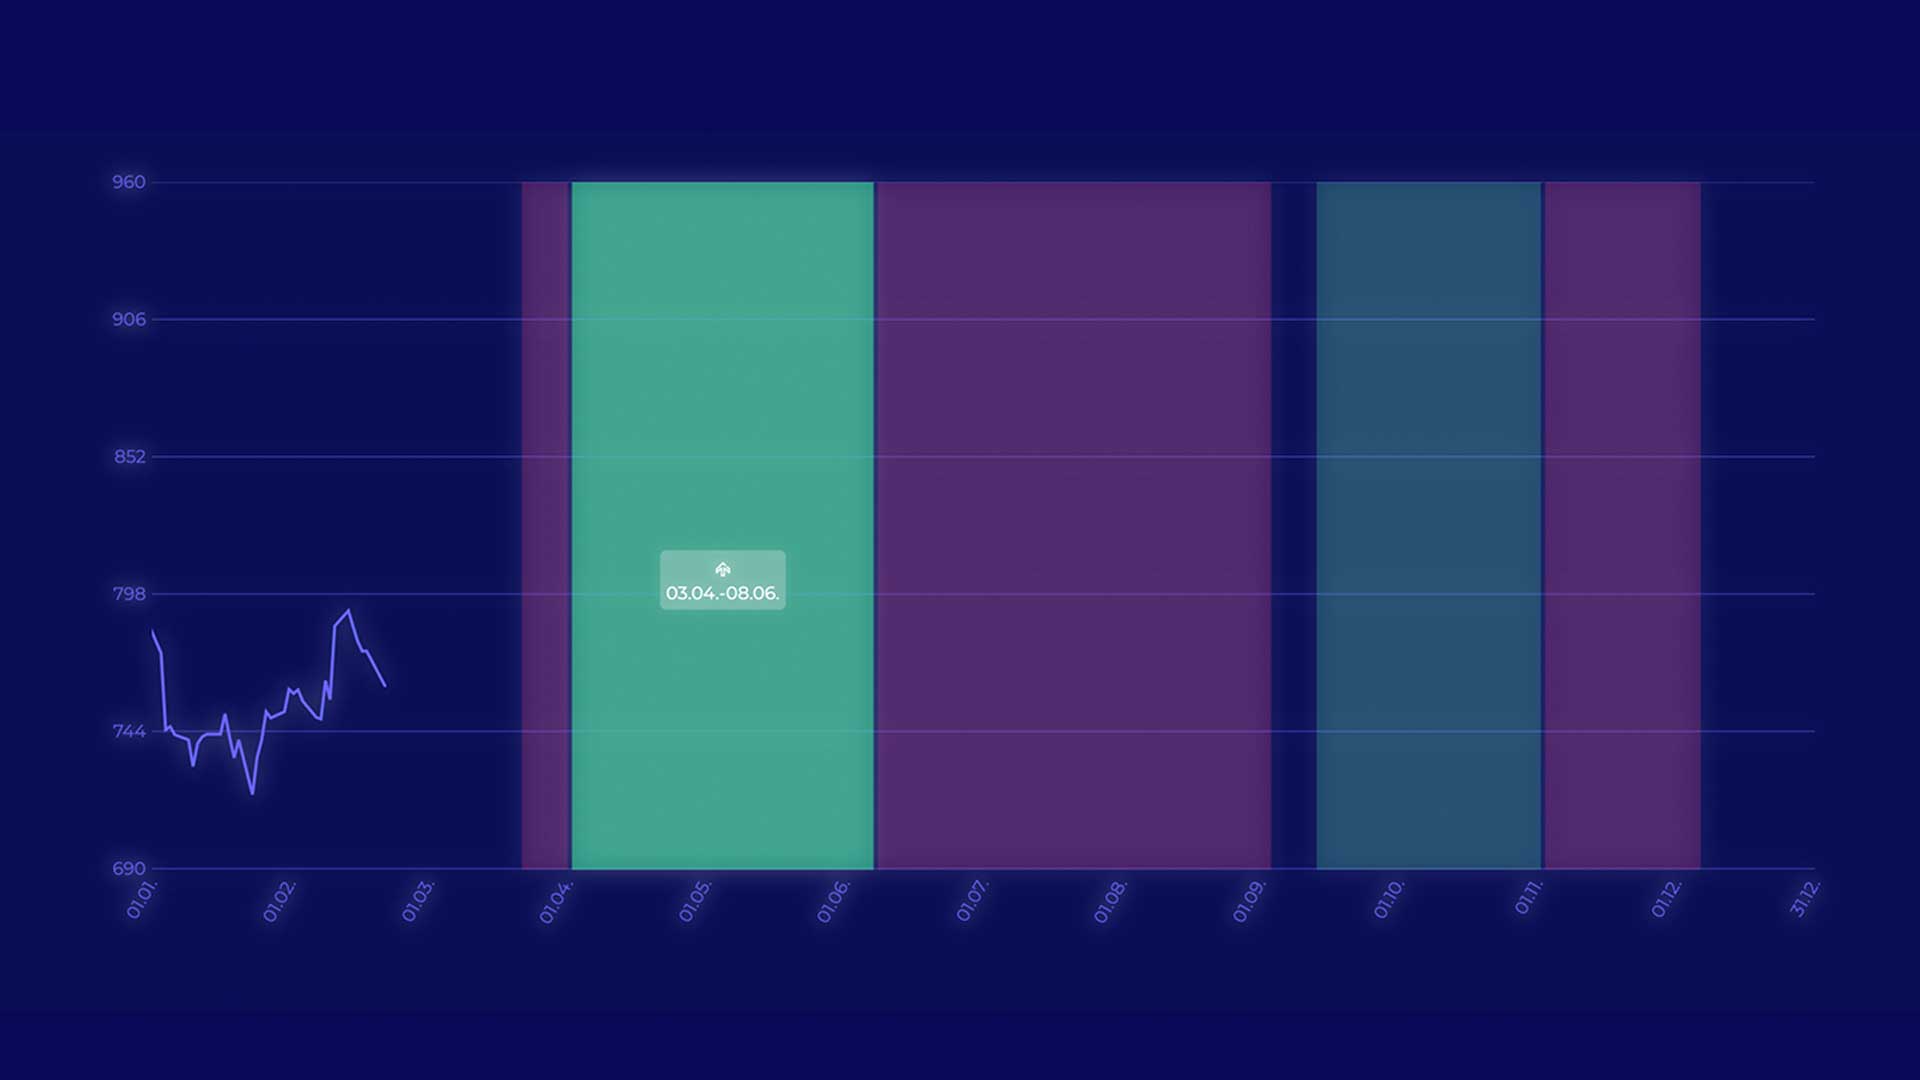
Seasonal patterns
Seasonality is a fundamental indicator that many traders underestimate. Most markets, especially commodities, tend to move more than average in one direction at certain times of the year. For example, grain prices typically increase during their harvest seasons. Professional traders take advantage of these seasonal patterns and use them to significantly increase the chance of successful trades. TradeNeon can show you at a glance whether and until when a market is in a seasonally interesting phase.

Tool 3
Term structure
Forward curves are probably the most important fundamental factor in the commodity markets. They can tell us when supply is becoming scarce in a market. In such phases, prices usually tend to rise sharply. Our forward curve indicator shows us graphically in a simple way when such supply shortages develop and when these situations resolve. This information can be used as a filter, but also for independent trading strategies.

7 Sentiment Indicators
Sentiment indicators that support your trade idea to increase your chances of winning. Check out our indicator tutorials now!
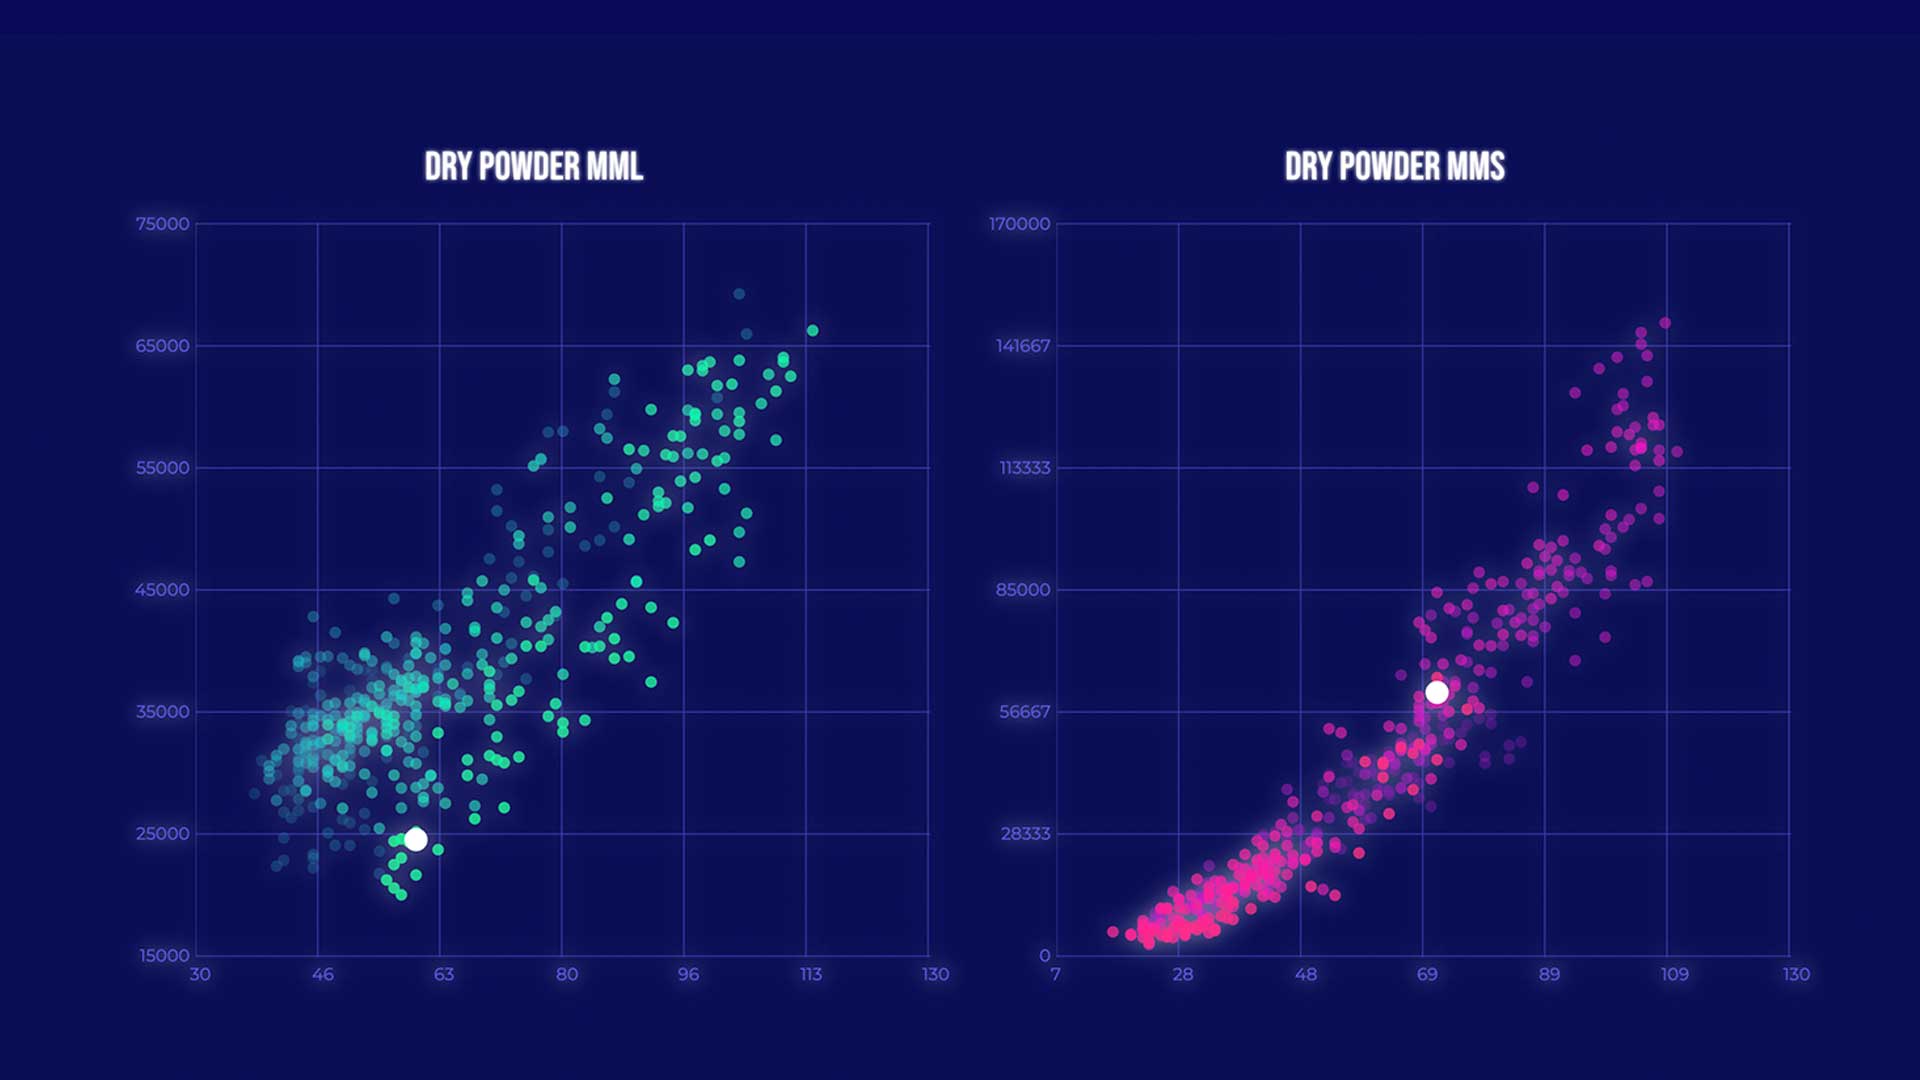
Dry Powder
The Dry Powder Indicator visualizes the absolute level of long and short open interests held by commercials and non-commercials, as well as the number of trading institutions holding these positions. The dot chart allows us to see how far these positions have expanded in recent years. This allows extreme values to be identified and analyzed at a glance.
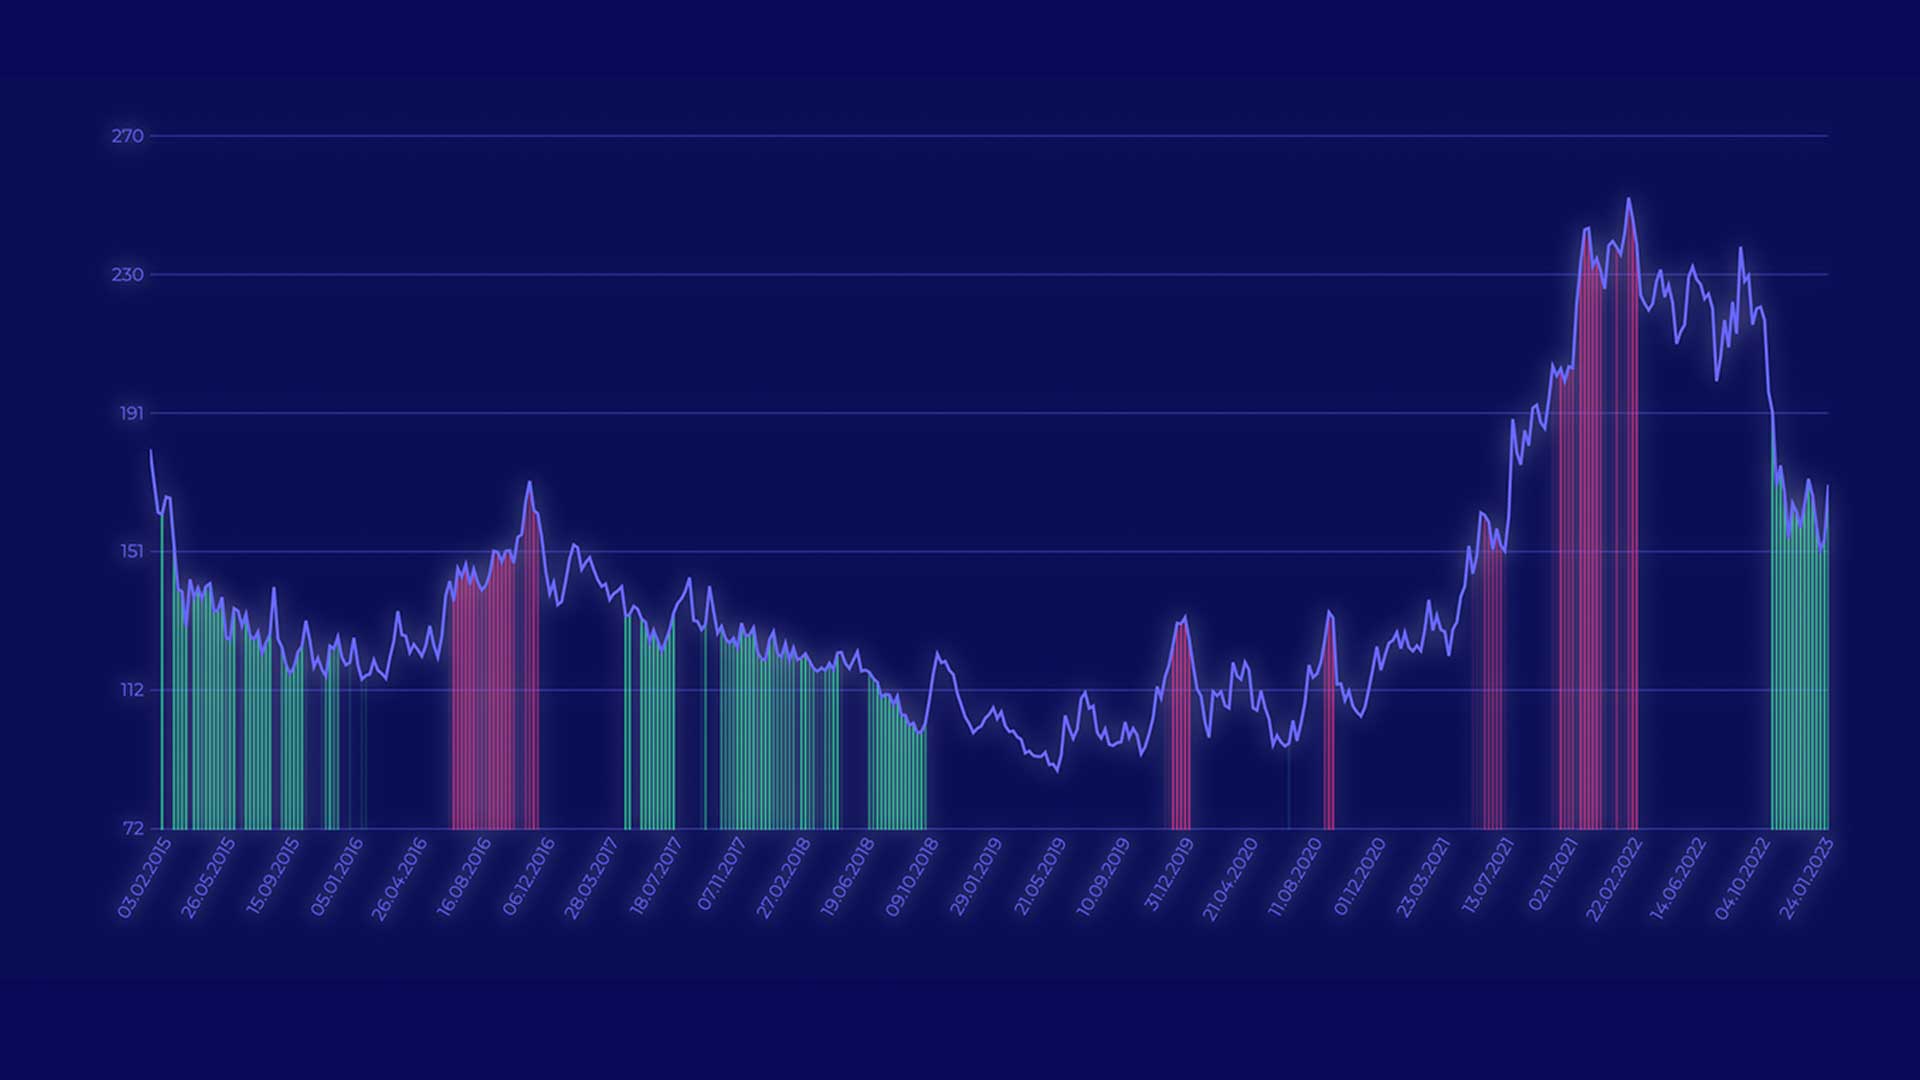
OBOS Price Indicator
One of the world's most advanced CoT analysis tools. It measures the relative positioning of commercials and non-commercials, the number of trading institutions holding these positions, as well as the current price and compares them to the total open interest and the extremes of the past year. This gives us meaningful and mathematically calculable fundamental signals.
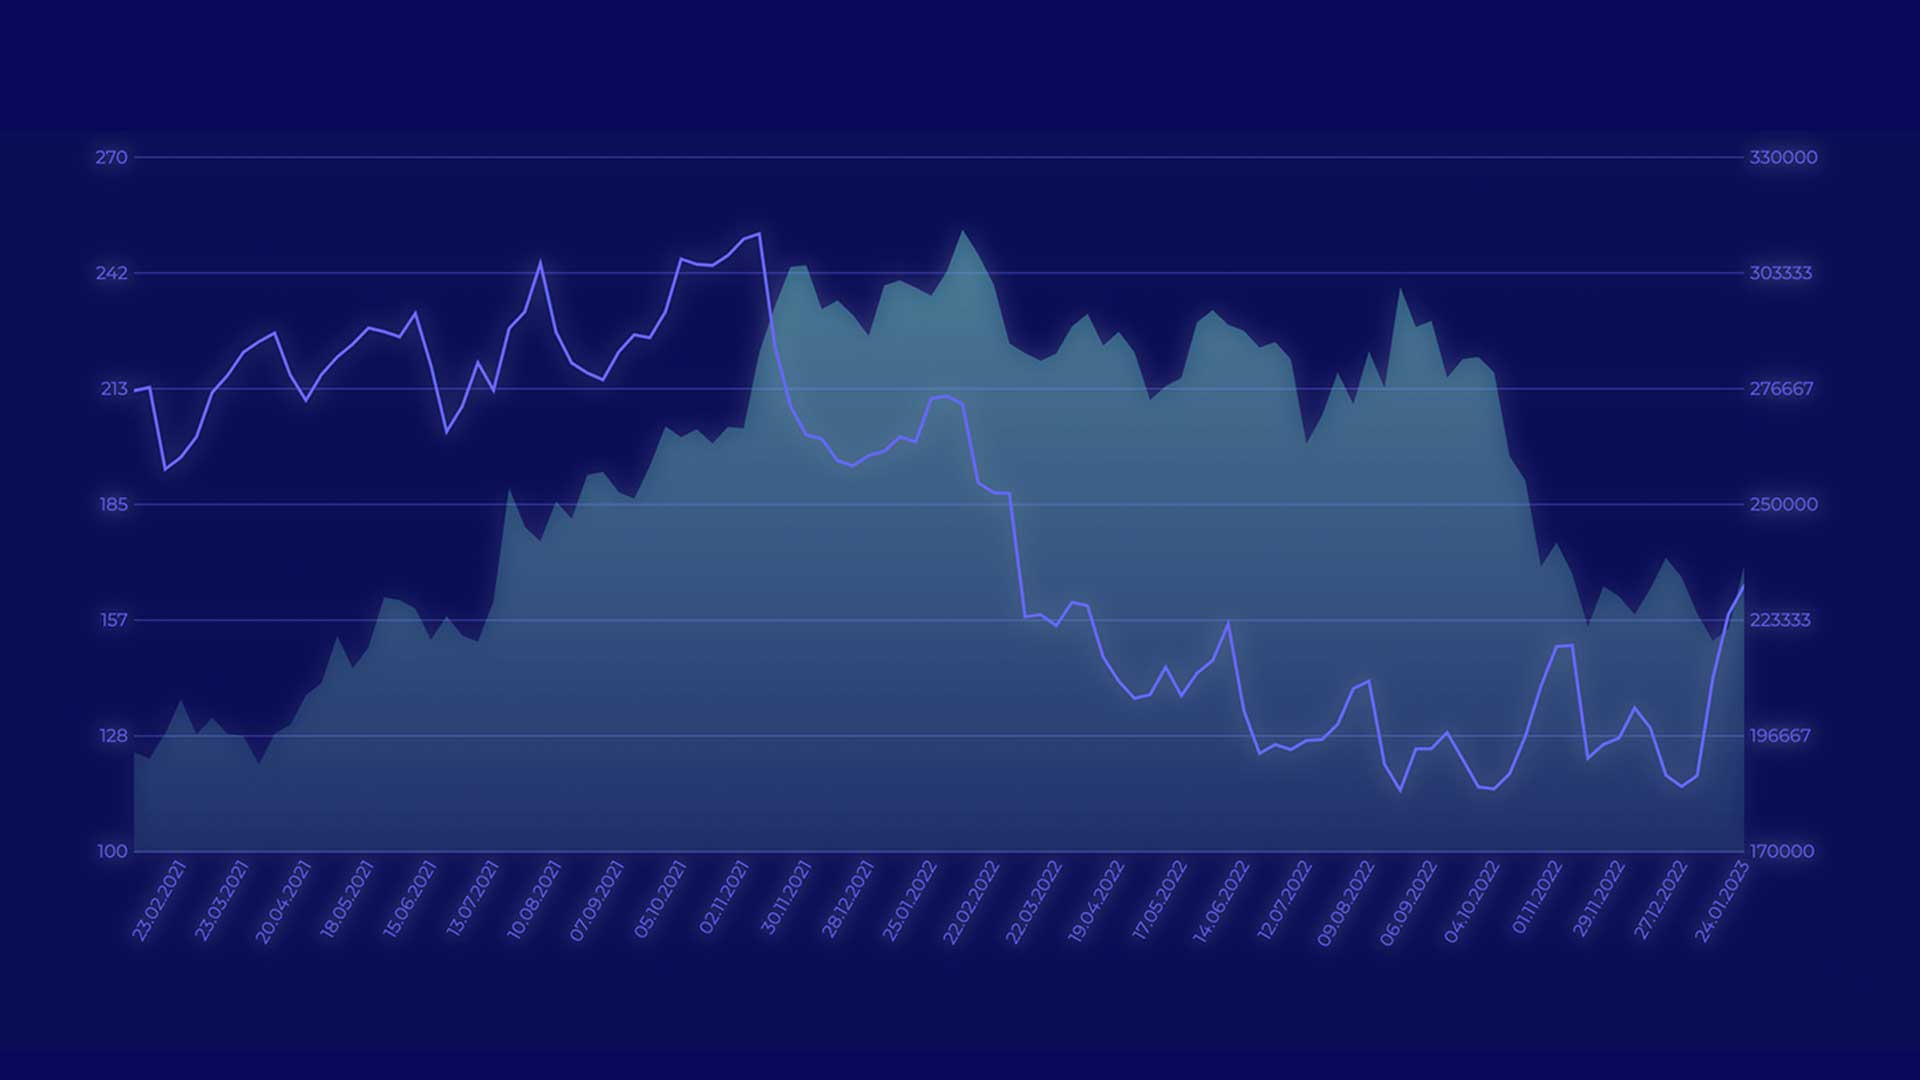
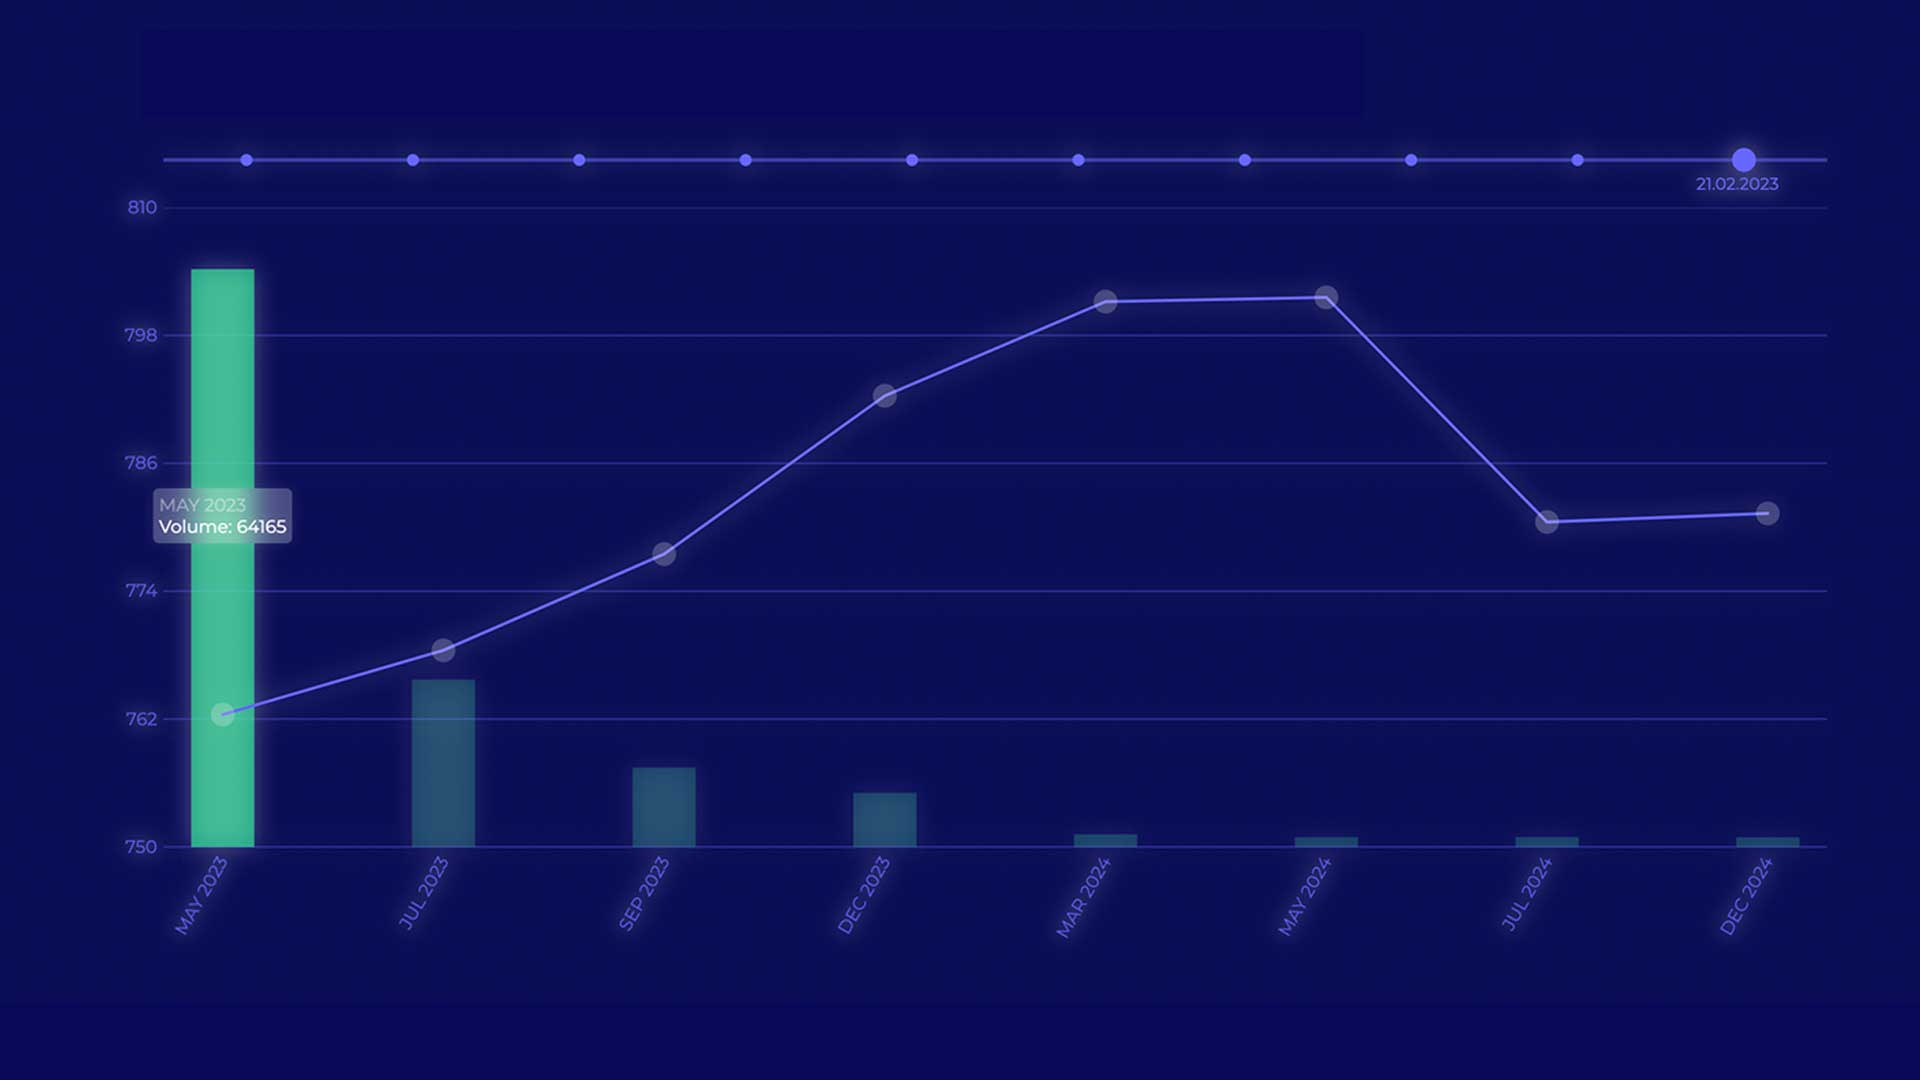
Open Interest
Open Interest is an important metric in trading. In addition to the overall interest, we can use it to determine whether a current trend is strong and new positions are being built, or whether market participants are beginning to lose interest in the trend movement.
Flow Cube
The Flow Cube compares the 3 factors of price, volume, and open interest to each other. This allows us to quickly determine whether new positions were built or reduced in relation to the previous week, what impact this had on the price, and how to assess the strength of the respective price movement.
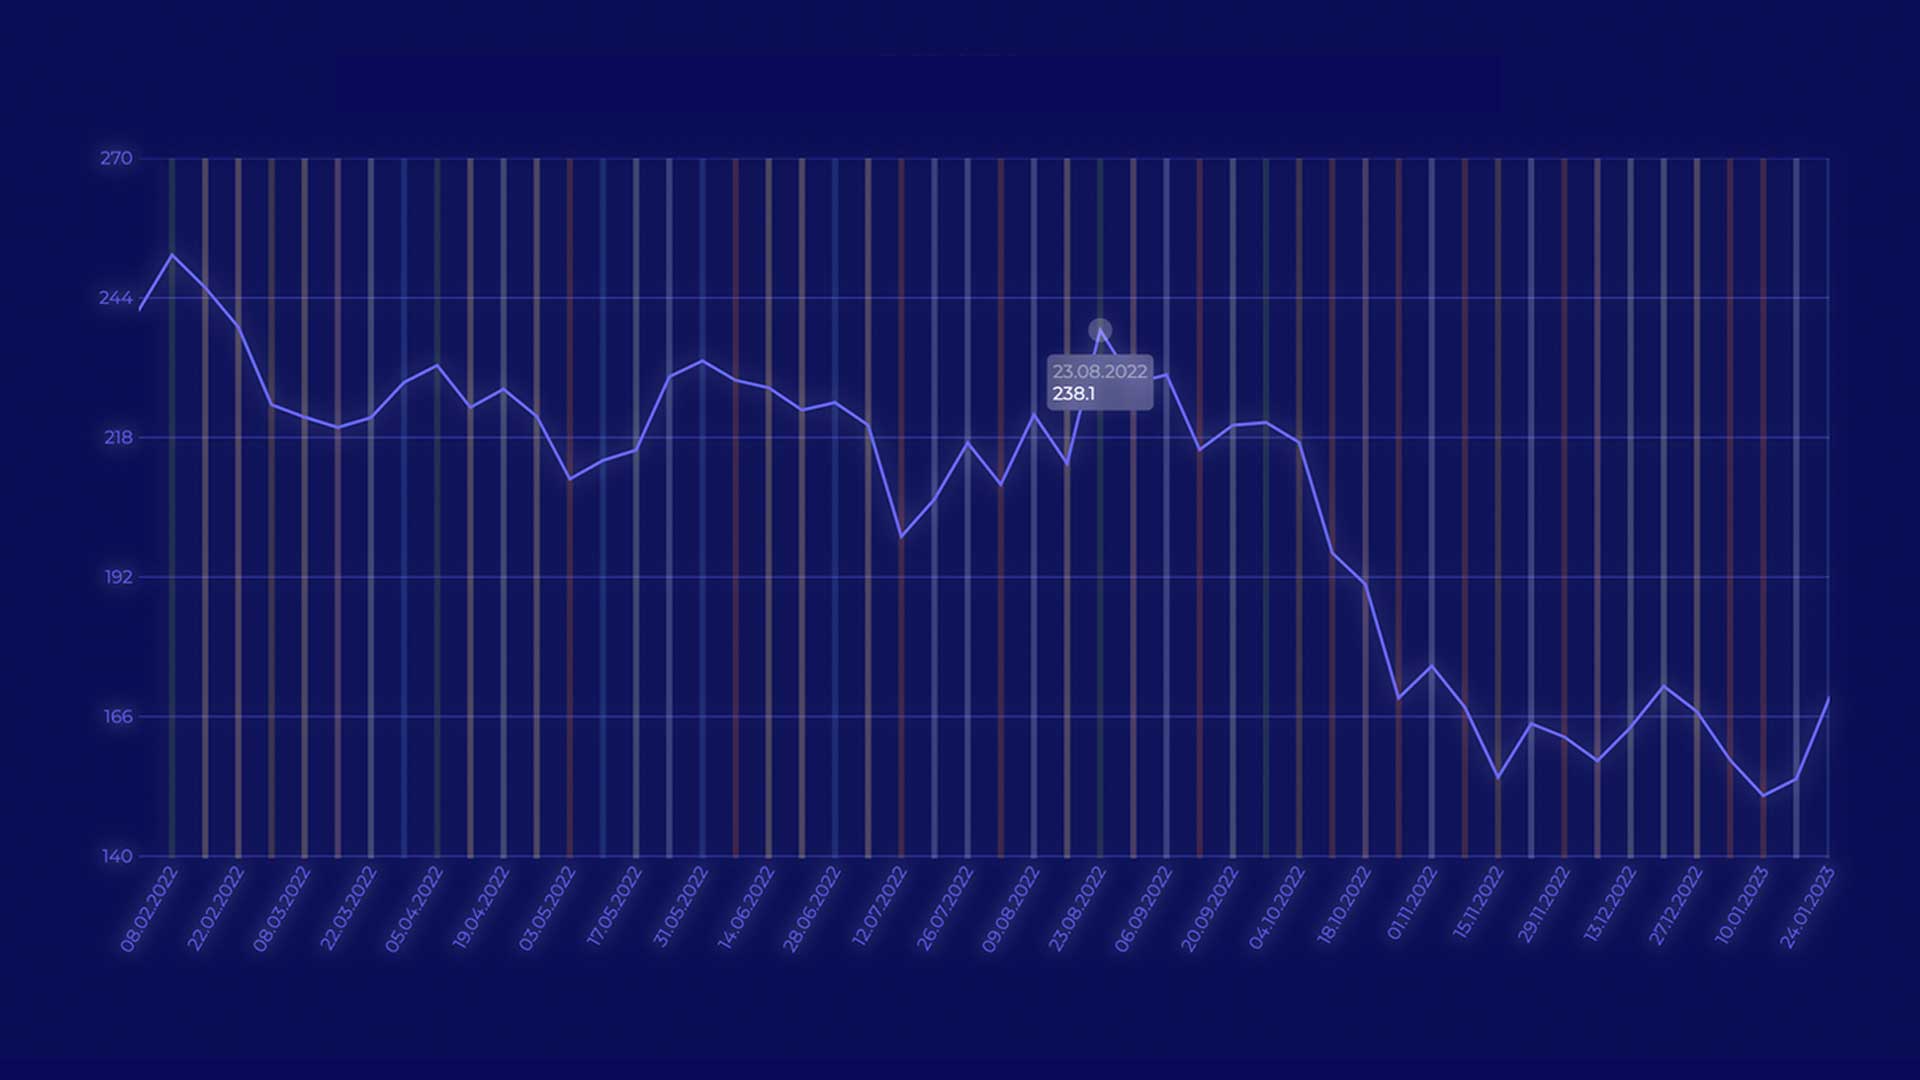
Seasonality
Commodity prices tend to strongly move in one direction or the other during certain monthly phases. For example, if a market has consistently risen during a certain period of time in at least 8 of the last 10 years, we can refer to this as seasonality. As traders, we can use these seasonal patterns to significantly increase our probability of profit for a trade.
Term structure
The term structure represents the end-of-day prices of the different contract months of a futures contract graphically side by side. At the beginning of the curve is the respective front contract, which had the highest trading volume the day before. By the slope of the resulting structure curve, we can deduce how urgently market participants need a particular commodity in the short term and whether the supply seems to be tightening.
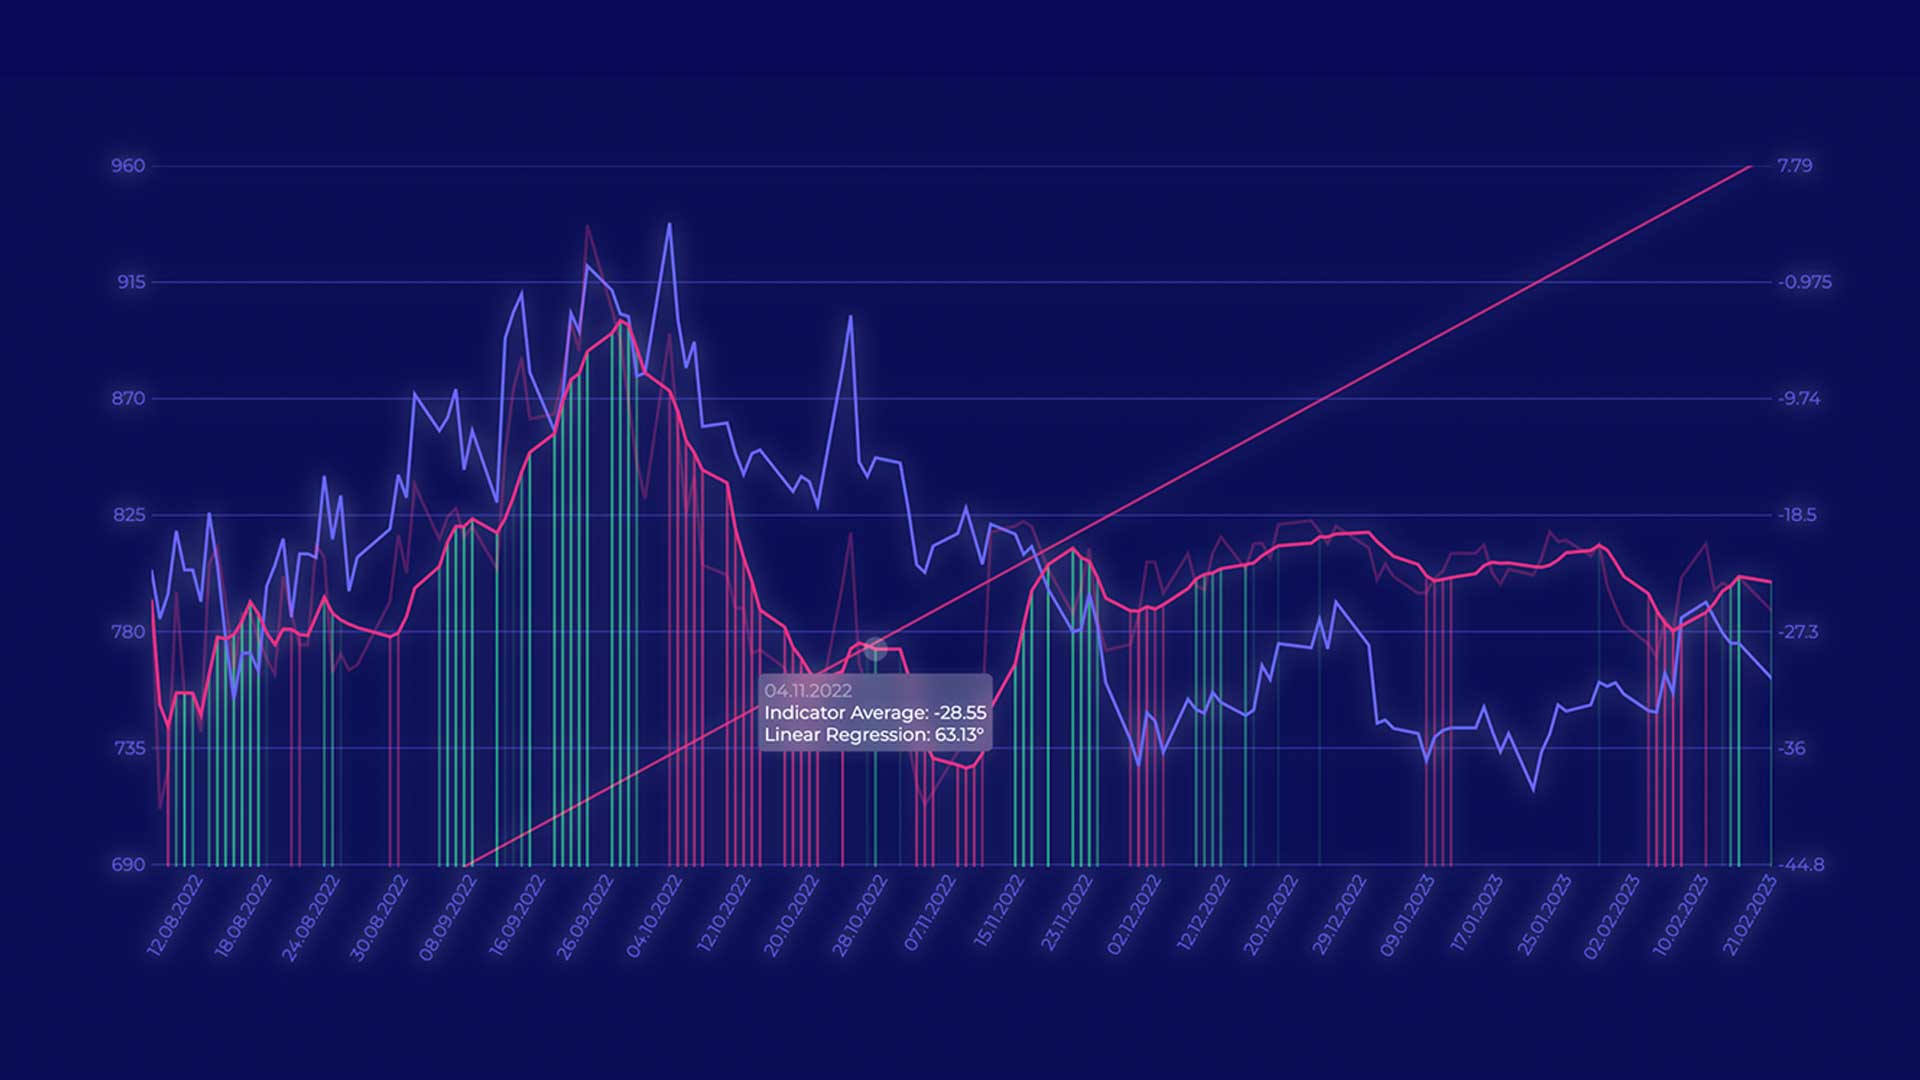
Difference Indicator
Our intelligent differential indicator measures the slope of the curve and graphically represents its development from day to day. This allows us to detect impending supply shortages and their resolution early on and position ourselves at the beginning of a developing trend.
25 markets

metals
metals
In addition to the classic precious metals gold and silver, TradeNeon also analyzes the industrial metals copper and platinum.

Energies
energies
The WTI crude oil future is one of the most important markets in the world. In addition, TradeNeon analyzes heating oil, RBOB petrol and natural gas.

grain
grain
Corn, soybeans and wheat are the largest grain futures markets. The analysis also includes soybean meal and soybean oil.

Soft Commodities
Soft Commodities
We also refer to the soft commodities as the breakfast markets. TradeNeon analyzes the largest of them, namely cocoa, sugar, coffee and cotton.

Meat
meat
The two most internationally traded meat futures are live cattle and lean hogs. Seasonal patterns are particularly interesting here.

currencies
currencies
TradeNeon analyzes the largest currency futures, the 6A, 6B, 6C, 6E, 6J and 6S. These include the most important currencies in relation to the US dollar.
Boost your Trades
TradeNeon
TradeNeon comes with 2 subscription models: Subscribe to the monthly plan and cancel anytime. Or choose the annual plan and save 33%! Start your 2 weeks free trial now!